
Arsenal are Premier League champions for 2025-26, finishing with 85 points and a seven-point margin over Manchester City. It was a title built on defensive solidity rather than attacking firepower, a distinction that matters when you look at the numbers across a season that produced more stories than most.
Below is a full data-driven breakdown of the season: how the table was shaped, which teams massively over- or under-delivered relative to the odds placed on them, what the betting market revealed, and a few patterns worth carrying into next season.
All stats are drawn directly from our database covering the full 380-match campaign. You can explore the underlying data further on the Premier League stats page.
Season at a Glance
| Champions | Arsenal - 85 pts |
| Runners-up | Manchester City - 78 pts |
| Champions League | Arsenal, Man City, Man Utd, Aston Villa, Liverpool |
| Europa League | Bournemouth, Sunderland |
| Conference League | Brighton |
| Relegated | Wolves (20 pts), Burnley (22 pts), West Ham (39 pts) |
| Total goals | 1,045 across 380 matches |
| Average goals per game | 2.75 |
The headline result across the season was a familiar one: the top two separated from the rest, with Man United (71 pts) a distant third. Below that the picture was considerably more complicated, as we will get to.
How Arsenal Won the Title
The title wasn't settled until the final weeks. City had been closing the gap and Arsenal's form had wavered, but when it mattered most, the two sides diverged sharply
Arsenal won their last five matches, taking 15 points from a possible 15. City managed just two wins and two draws in the same run, collecting eight points and handing Arsenal the breathing room they needed for their first Premier League title in 22 years.
Arsenal conceded just 27 goals all season. City conceded 35. In the entire 38-game Premier League era, only a handful of sides have ever finished a season with a lower goals-against total, and in the last decade, just three: Manchester City and Liverpool (both 26 in 2021-22) and Tottenham (26 in 2016-17). Arsenal kept 19 clean sheets compared to City's 16, and their away form was exceptional: 11 wins, five draws, three defeats, averaging 2.00 points per game on the road.
City's title challenge was ultimately undone by inconsistency at the back rather than a failure to create. They were the division's top scorers and generated the best attacking output on paper, but their defensive numbers cost them a title that the xPts data (see below) suggests they should have been in a closer fight for.
The Key Number: Arsenal conceded 27 goals in 38 games - the best defensive record in the division by eight goals, and one of the most miserly in the Premier League's modern history.
Was It a Predictable Season?
Over 380 matches, the team with shorter odds won just 49.5% of the time. Favourites drew 27.4% of games and lost to the underdog in 23.2% of them. This means that in almost one in four matches the team priced as the clear outsider took the points.
Seven results saw the winning team come in at odss of 6.0 or higher with the average market. The season's three biggest upsets:
| Date | Match | Scoreline | Winner's Odds |
|---|---|---|---|
| 24 May 2026 | Man City vs Aston Villa | 1-2 | 8.39 |
| 25 Oct 2025 | Chelsea vs Sunderland | 1-2 | 8.31 |
| 11 Apr 2026 | Arsenal vs Bournemouth | 1-2 | 7.06 |
Sunderland beating Chelsea 2-1 at Stamford Bridge at 8.31 is a result that tells you everything about how strange this season was for both clubs, for entirely different reasons. Arsenal's home defeat to Bournemouth, at odds of 7.06, was their most significant slip in an otherwise dominant campaign.
The draw rate of 27.4% was notably elevated, and as we will cover in the market section, that had meaningful implications for anyone backing results blindly.
Goals, Scorelines, and Patterns
The season averaged 2.75 goals per game, a figure that sits comfortably in the typical Premier League range. Over 2.5 goals occurred in 55% of matches; over 3.5 in 28.4%. Both teams scored (BTTS) in 56.1% of games.
The most common scoreline was 1-1, which occurred in 47 matches, 12.4% of the season. Taken alongside 2-1, 0-1, and 1-2, the four most frequent scorelines all involve at least one goal each side and none produce a margin larger than one. This was, for all its attacking football, a season where fine margins dominated.
| Scoreline | Occurrences | % of season |
|---|---|---|
| 1-1 | 47 | 12.4% |
| 2-1 | 37 | 9.7% |
| 0-1 | 31 | 8.2% |
| 2-0 | 29 | 7.6% |
| 0-0 | 27 | 7.1% |
For context on the extremes: Arsenal's defensive dominance is reflected in their clean sheet tally of 19. Crystal Palace kept 12, a quietly impressive defensive return for a side that finished 15th on 45 points, though their total of only 41 goals scored explains why that solidity translated to less points than it deserved.
Bournemouth drew 18 of their 38 matches - almost exactly half their games ended level. They won 13 and lost just seven, which sounds like a solid top-half season until you realise 57 points and a Europa League spot was built substantially on a record that included more draws than wins. That 18 is not just a curiosity, it is an outright Premier League record in the 38-game era. The previous best was 17, shared by Aston Villa, Newcastle and Sunderland across various seasons. The only teams ever to draw more in a single league campaign did so in the old 42-game format.
The season's worst attacking record away from home belongs to Wolves, who scored just eight goals in 19 away games and recorded zero away wins. They are only the fifth side in Premier League history to finish an entire 38-game season without winning on the road, and remarkably, the only club to have done it twice. Wolves achieved the same record in 2003-04, making them the sole repeat offenders in the league's history. They were relegated both times.
Home Advantage: Still Significant
Home teams won 42.6% of matches this season against 30.0% for away sides, with 27.4% draws. That 12.6 percentage-point gap between home and away win rates reflects a meaningful but not extreme home advantage, broadly consistent with the Premier League's recent trend.
The best home record in the division was Arsenal's: 15 wins, two draws, two defeats at the Emirates, averaging 2.47 points per game at home. The worst, genuinely extraordinary, belonged to Tottenham.
Spurs won just three home matches all season. Their home record (3W/6D/10L, 0.79 ppg) was worse than their away record (7W/5D/7L, 1.37 ppg). In a normal season, home advantage is something teams lean on; Tottenham's ground became a liability. They conceded 31 goals at home and scored only 22, finishing 17th with 41 points, just two points above the relegation zone, and only securing safety with a final-day win over Everton.
Overperformers and Underperformers
Expected points (xPts) measures what a team's results should have been based on the pre-match odds placed on every fixture. A team finishing well above their xPts delivered results the betting market did not anticipate. One finishing well below it had the quality the market priced in but failed to convert it consistently.
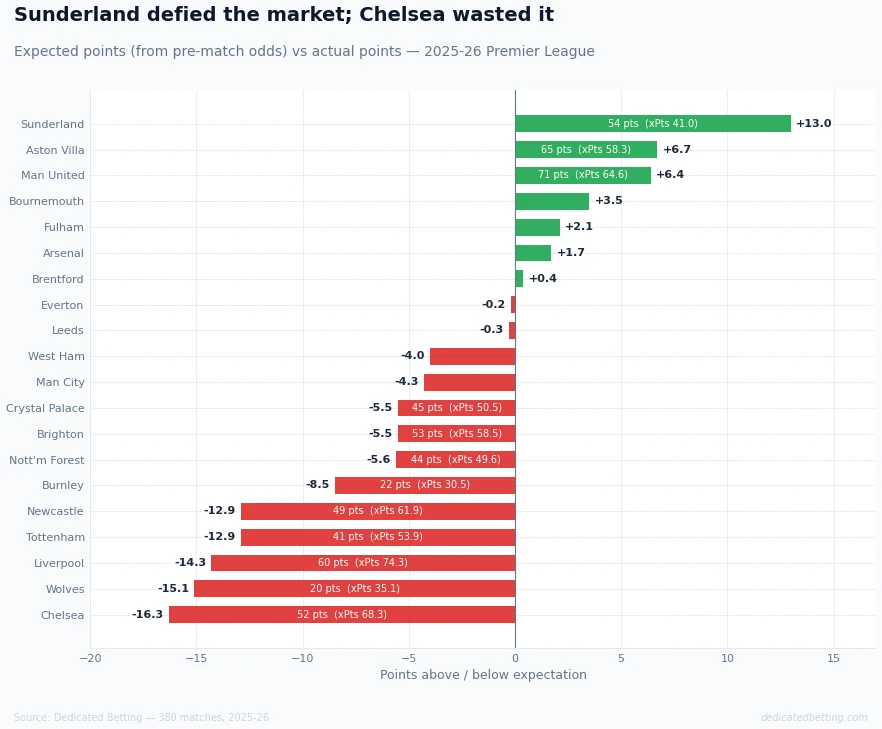
The three biggest overperformers:
| Team | Actual Pts | xPts | Difference |
|---|---|---|---|
| Sunderland | 54 | 41.0 | +13.0 |
| Aston Villa | 65 | 58.3 | +6.7 |
| Man United | 71 | 64.6 | +6.4 |
Sunderland's +13.0 is the headline, in their first season back in the top flight the market consistently underestimated them. Across 38 games they outperformed their expected points by 13, which is not a run of fortune, and over a full season it reflects a team that repeatedly performed better than the price on them suggested they would. Finishing seventh and qualifying for Europe was remarkable enough; doing it while being the division's biggest statistical overachiever makes it more so.
The three biggest underperformers:
| Team | Actual Pts | xPts | Difference |
|---|---|---|---|
| Chelsea | 52 | 68.3 | −16.3 |
| Wolves | 20 | 35.1 | −15.1 |
| Liverpool | 60 | 74.3 | −14.3 |
Chelsea's -16.3 is the most striking number in the entire dataset. The market priced them as a team capable of accumulating 68 points, a likely top-four side, but they finished tenth with 52. Their goals return (58 scored, 52 conceded) was not as bad as the table suggests, and their away record was even (7W/5D/7L). Something went consistently wrong for Chelsea this season in the moments that mattered.
Liverpool at -14.3 is the other major story. They qualified for the Champions League in fifth but were, on the evidence of the odds, priced throughout the season as a genuine title contender. The betting market was never right about them in 2025-26.
It is also worth noting that Manchester City finished -4.3 points below their xPts. The gap between Arsenal (xPts 83.3, actual 85, difference +1.7) and City (xPts 82.3, actual 78, difference -4.3) in expected terms was just one point. Arsenal outperformed expectations marginally; City underperformed them. The title was far closer than the final seven-point gap suggests.
Betting Market Verdict
Across all 380 matches, three of the four basic flat-stake approaches produced a loss. One produced a profit.
| Bet | ROI |
|---|---|
| Back home team | −9.5% |
| Back draw | +6.5% |
| Back away team | −10.4% |
| Back favourite | −9.8% |
Backing the draw returned +6.5% across the season, the only profitable of the four basic strategies. The average draw odds were 3.98, implying the market priced a draw at roughly 25%. The actual draw rate was 27.4%. That gap of 2.3 percentage points, sustained across a full 380-match season, produced a consistent structural mispricing that a flat-stake draw backer would have profited from all year.
At the team level, the backing ROI figures mirror the xPts story closely:
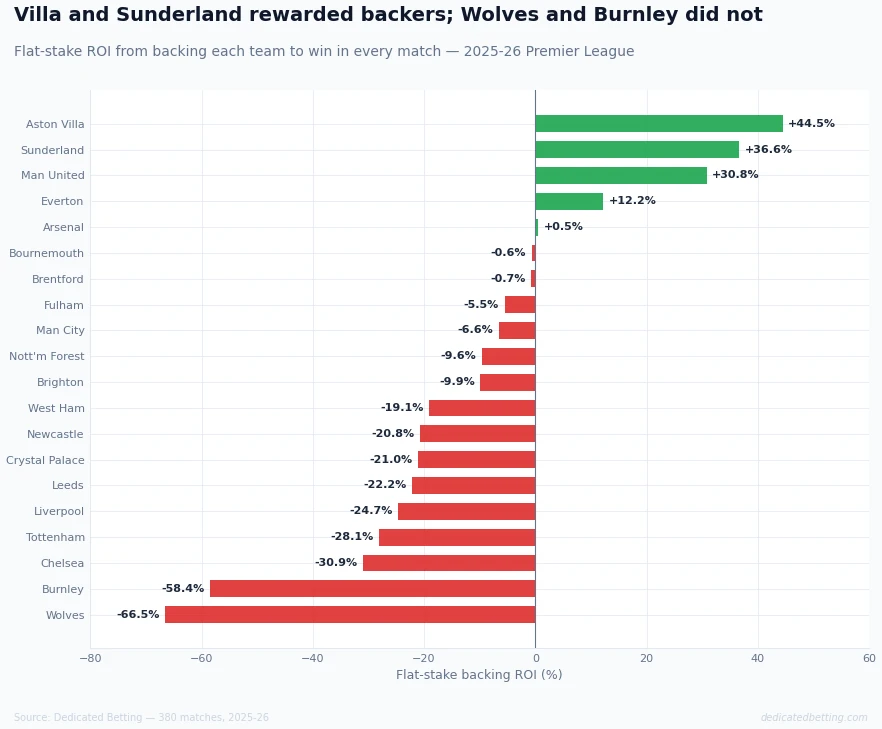
| Team | Backing ROI |
|---|---|
| Aston Villa | +44.5% |
| Sunderland | +36.6% |
| Man United | +30.8% |
| ... | |
| Chelsea | −30.9% |
| Burnley | −58.4% |
| Wolves | −66.5% |
Aston Villa and Sunderland dominate the profitable end , consistent with their xPts overperformance. The market repeatedly underpriced them, meaning their wins came at long enough odds to generate a return. Arsenal, despite winning the title, returned just +0.5%. Consistently priced as favourites, their wins produced minimal backing profit.
At the other end, Wolves at -66.5% reflects a team priced generously throughout the season, correctly, as it turned out. Chelsea at -30.9% is the painful counterpart to their xPts story: the market liked them, they failed to perform, and any systematic backer lost heavily.
Looking Ahead to 2026-27
The 2025-26 season produced a clear champion, one of the most statistically dominant defensive records in modern Premier League history, a newly promoted club that defied the market for an entire year, and a title race that the underlying numbers suggest was considerably tighter than it appeared. The table flattered Arsenal only marginally; it flattered City significantly less.
Three things the data suggests going into 2026-27:
1. Chelsea are a correction waiting to happen. Their expected points of 68.3 was higher than Liverpool, higher than Aston Villa, and would have placed them fourth in the actual table. They finished tenth with 52. A -16.3 gap across a full 38-game season is not variance, it is structural failure to convert quality into results. The market will likely price them cautiously next season. That caution may be overdone.
2. Sunderland's ceiling is still unknown. A newly promoted side finishing seventh while being the most statistically underrated team in the division is one kind of story. The question is whether bookmakers simply haven't caught up with them, or whether their +13 xPts reflects an exceptional but unsustainable run of outperforming expectations. If the market reprices them sharply, the backing ROI that made them the second most profitable team to back this season disappears. The more interesting version of next season is that they prove the overperformance was real.
3. The draw market is worth watching again. The 2025-26 draw rate of 27.4% was the highest in ten years - the last time draws were more common was 2015-16, when 28.2% of matches ended level. In the nine seasons between 2016-17 and 2024-25, the draw rate never exceeded 26.1%. The elevated rate this season was driven partly by Bournemouth (18 draws), but also by Chelsea (10), Man United (11), and Brentford (11) - sides whose tendency to draw rather than win or lose depressed the market's pricing of the draw across the season. Whether those tendencies persist into 2026-27 will determine whether the draw mispricing recurs.
In Closing: Every stat in this article was tracked live throughout the season on our Premier League page and team pages. We'll be doing the same from day one of 2026-27 - bookmark us and get ahead of the market before the season starts.*
Related articles
Does home advantage still matter in football?
Home teams won 42.6% of Premier League matches this season. Our full Home Advantage in Football analysis covers how that figure has evolved over 30 years and what it means in practice for betting.
Which leagues have the biggest home advantage?
The Premier League's home advantage is real but moderate compared to some European competitions. Our league comparison article ranks all 22 leagues and explains what drives the differences.
Football betting bankroll management
The draw ROI and team ROI figures above only mean something if your stake sizing gives you enough runway to play out over a full season. Our bankroll management guide covers the practical framework.