Who will win?
It is the first question most people ask before betting on a football match. It is also the question that prediction sites, tipsters and betting conversations are built around.
The problem is that identifying the most likely winner does not tell you whether that team is worth backing.
We tested this distinction across 182,356 league matches in 22 European divisions, covering the 24 completed seasons from 2002/03 to 2025/26. In every fixture, we selected the shorter-priced of the two teams as the predicted winner and placed a theoretical one-unit bet at the recorded bookmaker odds.
The prediction was correct in 49.92% of all matches and 68.03% of matches that produced a winner. Despite that apparent success, the bets lost 9,869.3 units, an ROI of −5.41%.
Key finding: Picking the more likely team was not difficult. Getting a price that turned those predictions into profitable bets was much harder.
The Most Likely Winner Is Not Always the Best Bet
Our analysis of betting against the bottom team produced a useful example.
The bottom team's opponent won 50.6% of 14,595 qualifying matches. That sounds like a reasonably successful way to pick winners. Backing every opponent still lost 6.40% of stakes.
The issue was not that the opponents failed to win often enough to appear strong. It was that their odds already reflected their greater chance of winning.
A team can therefore be:
-
The stronger team.
-
The most likely winner.
-
Correctly predicted to win.
-
A poor bet at the available price.
Those statements can all be true at the same time.
The shorter-priced team won 91,037 of 182,356 matches, but backing every predicted winner returned −5.41%.
Probability Has to Be Converted Into a Price
A useful football prediction should not stop at naming a team. It should estimate how likely each result is.
Once you have a probability estimate, you can convert it into fair decimal odds:
Fair odds = 1 ÷ estimated probability
The probability must be written as a decimal in the calculation. A 50% estimate becomes 0.50, so its fair odds are 1 ÷ 0.50 = 2.00.
| Estimated probability | Fair decimal odds |
|---|---|
| 25% | 4.00 |
| 33.3% | 3.00 |
| 40% | 2.50 |
| 50% | 2.00 |
| 60% | 1.67 |
| 66.7% | 1.50 |
| 75% | 1.33 |
If you estimate that a team has a 50% chance of winning, three prices tell three different stories:
-
Odds of 1.80 are below your fair price. Your estimate does not make that a value bet.
-
Odds of 2.00 are theoretically break-even before considering whether your estimate is reliable.
-
Odds of 2.20 are above your fair price and may offer value if your 50% estimate is well founded.
Fair odds do not predict what will happen in one match. They describe the price at which your estimated probability would theoretically break even across many comparable bets.
The calculation can also be reversed:
Break-even probability = 1 ÷ decimal odds
At odds of 1.50, you need to win approximately 66.7% of bets to break even. At odds of 4.00, you need to win 25%.
This is why comparing strike rates without comparing prices is of limited use.
What Happened When We Picked the More Likely Team?
For each match, we compared the home and away win prices and selected the shorter-priced team. Draws counted as incorrect predictions and losing bets.
The relationship between odds and accuracy was exactly what we would expect. The shortest-priced teams won most often.
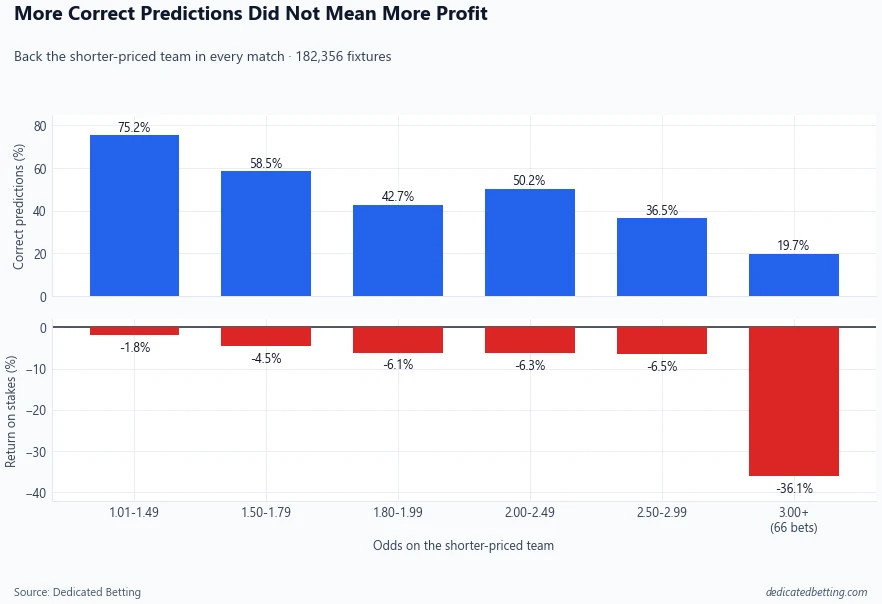
Teams priced below 1.50 won 75.21% of their matches. That was the highest strike rate by a considerable margin, yet backing all 20,888 selections still lost 1.81% of stakes.
The pattern continued as prices increased:
| Average odds | Bets | Correct predictions | ROI |
|---|---|---|---|
| 1.32 | 20,888 | 75.21% | −1.81% |
| 1.64 | 35,407 | 58.49% | −4.55% |
| 1.87 | 28,718 | 50.18% | −6.33% |
| 2.21 | 76,287 | 42.65% | −6.13% |
| 2.57 | 20,990 | 36.47% | −6.49% |
The small group priced at 3.00 or higher contained only 66 matches because it is unusual for both teams to be available above that level. Its result is shown in the chart for completeness, but the sample is too small to carry much weight.
The broader conclusion is clearer. Prediction accuracy changed dramatically across the price ranges. Profitability did not. Every group lost money.
How Can a 75% Strike Rate Lose Money?
A 75% win rate sounds excellent until it is compared with the price required to support it.
| Decimal odds | Break-even win rate |
|---|---|
| 1.25 | 80.0% |
| 1.33 | 75.2% |
| 1.50 | 66.7% |
| 2.00 | 50.0% |
| 3.00 | 33.3% |
| 5.00 | 20.0% |
Suppose you place 100 bets at odds of 1.25 and win 75 of them.
The 75 winners earn 18.75 units of profit, while the 25 losers cost 25 units. Despite getting three quarters of your predictions right, you finish 6.25 units down.
Accuracy only becomes meaningful for betting when it is judged against the odds. A lower strike rate can be profitable at sufficiently high prices, while a high strike rate can lose money when prices are too short.
What this means for bettors: Do not ask whether a strike rate looks impressive. Ask whether it is higher than the break-even rate required by the prices taken.
What About Matches That Ended in a Draw?
Draws explain why the shorter-priced team won fewer than half of all fixtures.
Of the 182,356 matches, 48,539 ended level, equivalent to 26.62% of the sample. The shorter-priced team was therefore correct in 49.92% of all matches, but in 68.03% of matches where either team won.
That second figure sounds far more impressive. It did not improve the betting result because draws are real losing outcomes when backing a team to win.
The shorter-priced team won more than two thirds of decisive matches. Draws still lost the full stake, leaving the overall strategy 9,869.3 units down.
This illustrates a common problem with prediction statistics. A hit rate can be made to look stronger by changing what counts as an eligible match or excluding awkward outcomes. The betting account does not exclude them.
Did Picking the Likely Winner Ever Work for a Full Season?
No. Backing the shorter-priced team produced a loss in all 24 seasons in the study.
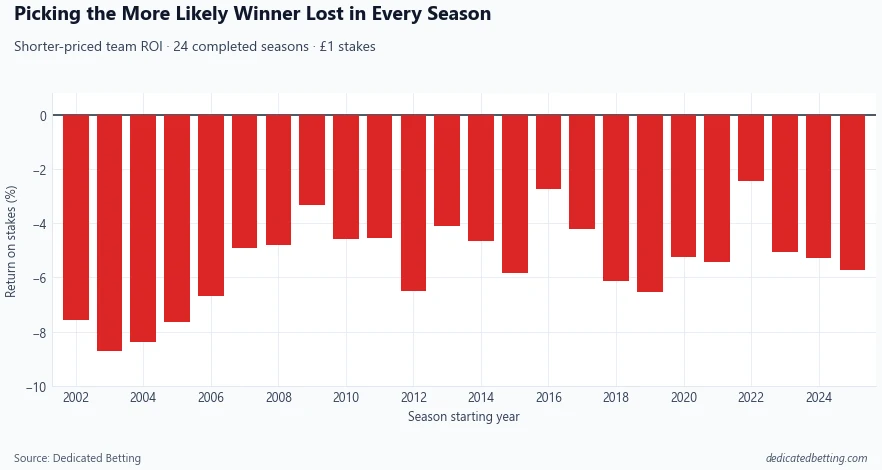
The least damaging season was 2022/23, when the strategy returned −2.44%. The worst was 2003/04 at −8.70%.
Prediction accuracy barely moved by comparison. It ranged from 48.51% to 51.21% across the 24 seasons. A relatively stable ability to identify the more likely winner did not translate into a profitable betting record.
This consistency matters. The overall loss was not created by one unusual season or a brief period of poor results. The same basic outcome appeared throughout the sample.
Why Did the More Likely Teams Still Lose Money?
Bookmaker odds are not simply forecasts. They are prices that include a margin.
Across the full sample, the shorter-priced teams won 49.92% of matches. After removing the margin from the three match-result prices, their average market-implied probability was 49.01%.
The actual win rate was therefore 0.92 percentage points higher than that normalised market estimate. Even this was not enough to make the quoted prices profitable.
The distinction is important:
-
Normalised market probability estimates how the market divided the chances after removing its margin.
-
Quoted odds determine what the bettor was actually paid.
A selection can perform slightly better than the normalised probability and still lose money because the bet is settled at the original price containing the margin.
This also explains why always choosing the market favourite is not a free prediction system. The market is effective at ranking outcomes by likelihood, but bettors must still overcome the price they are offered.
A Correct Prediction Can Still Be a Bad Decision
Imagine that a team wins after you back it at 1.50. The bet was successful, but the result alone does not prove that the decision was good.
If the team's true chance was only 60%, fair odds would have been approximately 1.67. Taking 1.50 would have been a poor price even though this particular bet won.
The reverse also applies. A team estimated at 30% may lose when backed at 4.00. That individual bet failed, but the price would still have been attractive if the 30% estimate was reliable, because fair odds for that probability are 3.33.
This is uncomfortable because results are visible immediately while the quality of a probability estimate only becomes clear across a large sample.
One winning bet does not validate the reasoning. One losing bet does not disprove it. Long-term performance depends on whether the probabilities and prices were favourable across many decisions.
What Should Bettors Ask Instead?
“Who will win?” remains a useful starting point for analysing a match. It is not enough to make a betting decision.
A better sequence of questions is:
-
What probability do I assign to each possible outcome?
-
What fair odds follow from those probabilities?
-
How do my fair odds compare with the available prices?
-
Is my method for estimating probabilities tested against historical matches?
-
Does the apparent advantage survive across leagues, seasons and a meaningful sample?
The available price should change your decision. If it does not, you are choosing a team rather than evaluating a bet.
Our head to head pages show match probabilities alongside current odds, recent form, team comparisons and market movement. The purpose is not merely to name a likely winner. It is to show how the statistical view compares with the price currently available.
Our league pages also provide wider context, including market performance, home and away records, current form and league predictability. These can help explain a probability estimate, but none should be treated as a profitable signal without considering the odds.
How We Tested the Question
The analysis used 182,356 completed league matches across 22 European divisions from 2002/03 to 2025/26.
For every fixture with valid recorded home, draw and away bookmaker odds, we selected the shorter-priced of the home and away teams. That team became the predicted winner. If both team prices were equal, the home team was selected. A correct team win returned the recorded decimal odds; a draw or victory for the other team lost one unit.
We then measured:
-
Prediction accuracy across all matches.
-
Accuracy among matches that produced a winner.
-
Profit and ROI from one-unit stakes.
-
Results across different odds bands.
-
Results in each of the 24 seasons.
The analysis does not claim that bookmaker odds are a proprietary prediction model. We used them because they provide a consistent, measurable way to identify which team the market considered more likely to win.
The recorded prices may differ from odds available to an individual bettor at a particular time. Returns do not account for account restrictions or the practical ability to place every bet. Historical results do not establish future returns.
Final Verdict
“Who will win?” is not a useless question. It is an incomplete one.
Across more than 182,000 matches, the betting market's shorter-priced team won almost half of all fixtures and more than two thirds of matches that produced a winner. Backing those teams still lost 5.41% of stakes, and every one of the 24 seasons finished in the red.
Short prices produced more winners. They did not automatically produce value.
Final thought: Do not judge a football bet by how likely the team is to win. Judge it by whether the available odds are greater than a reliable estimate of its fair price.
Data from the Dedicated Betting database: 182,356 completed league matches across 22 European divisions and 24 seasons from 2002/03 to 2025/26. The shorter-priced home or away team was treated as the predicted winner. Returns use one-unit stakes at recorded bookmaker odds. Historical results do not guarantee future returns.
Related football articles
Is betting against the bottom team profitable?
Our bottom-team betting analysis shows why winning more than half of the bets still produced a long-term loss.
What do simple football betting strategies return?
See how favourites, home teams, draws and underdogs performed in Football Betting Strategy: What the Data Actually Shows.
Is betting on favourites profitable?
Our favourites analysis examines how venue, price and time period changed the result.