World Cup 2026 was always going to be bigger. Forty-eight teams, 104 matches and a new Round of 32 guaranteed more football than any previous edition.
What nobody could guarantee was whether more football would mean better football.
The answer, at least from the scoreboard, was an emphatic yes. The tournament produced 308 goals at 2.96 per match, ran more than 43 goals above its combined expected-goal total and delivered everything from England's 6–4 win over France to Spain's controlled 1–0 victory over Argentina in the final.
Those two games could hardly have been more different. One was a ten-goal shootout. The other needed 106 minutes to produce a single goal.
Together, they captured the tournament rather well: noisy, unpredictable and unusually prolific, but ultimately won by the team best able to remove the chaos.
This is World Cup 2026 through the numbers.
World Cup 2026 at a Glance
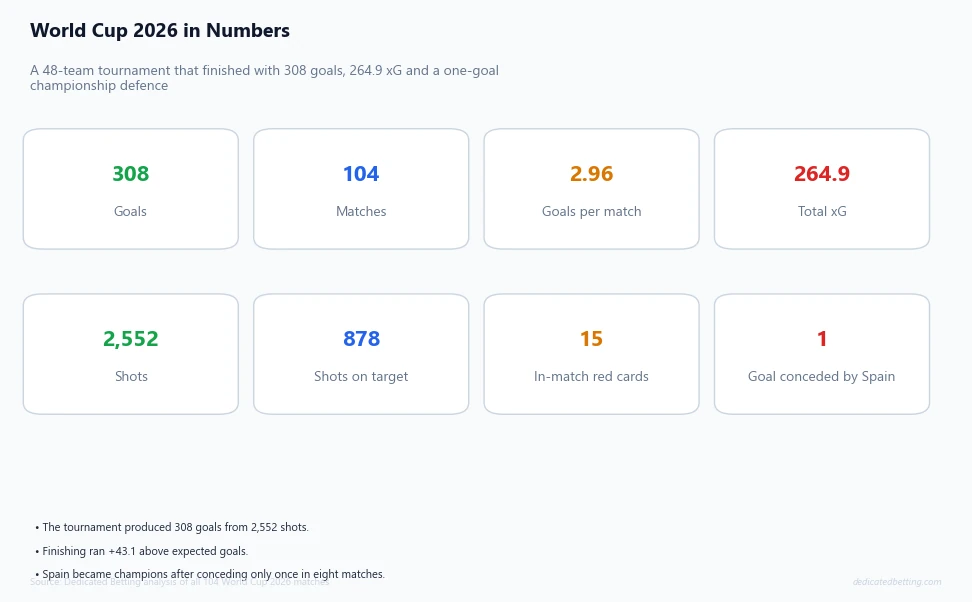
Goals were scored across 104 matches, an average of 2.96 per game.
Goals above expected. The tournament generated 264.9 xG but finished with 308 goals.
Goal conceded by champions Spain across eight matches. Belgium were the only team to score against them.
The raw goal total is eye-catching, but it needs context. A 48-team World Cup contains 40 more matches than Qatar 2022, so 2026 was always likely to set a new record for total goals.
The more useful number is 2.96 goals per match. That tells us the increase was not only a consequence of expansion. Even after adjusting for the larger schedule, this was a genuinely high-scoring tournament.
There were 2,552 shots, of which 878 were on target. That works out at 24.5 shots and 8.4 shots on target per match. The overall shot-conversion rate was 12.1%, while 35.1% of shots on target became goals.
The standout number, though, is the gap between goals and xG.
A tournament can finish slightly above or below expectation without it meaning much. A 43.1-goal surplus is different. Finishing ran hot from the group stage to the knockout rounds, and several teams converted chances at rates that would be difficult to sustain over a longer season.
Where Did the Goals Come From?
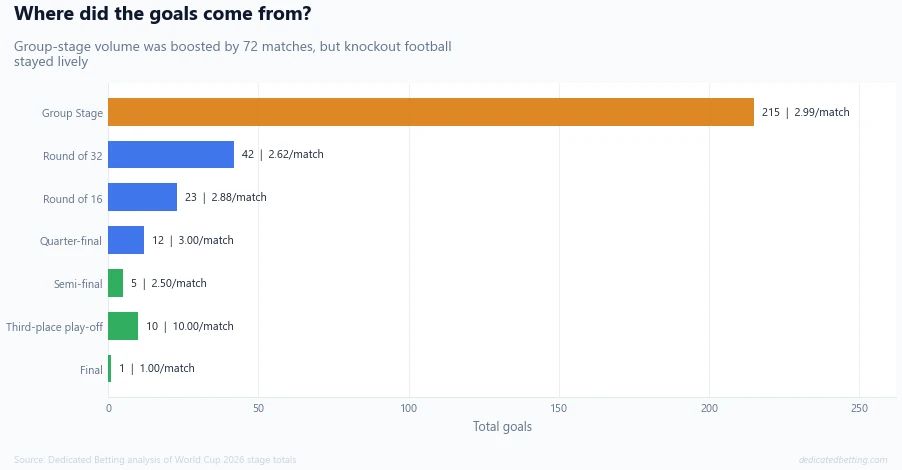
| Stage | Matches | Goals | Goals per match |
|---|---|---|---|
| Group stage | 72 | 215 | 2.99 |
| Round of 32 | 16 | 42 | 2.62 |
| Round of 16 | 8 | 23 | 2.88 |
| Quarter-finals | 4 | 12 | 3.00 |
| Semi-finals | 2 | 5 | 2.50 |
| Third-place play-off | 1 | 10 | 10.00 |
| Final | 1 | 1 | 1.00 |
The group stage supplied 215 goals, almost 70% of the tournament total. That is partly volume — it contained 72 of the 104 fixtures — but its rate of 2.99 goals per match was also almost identical to the tournament average.
The arrival of knockout football did not immediately close games down. The Round of 16 averaged 2.88 goals and the quarter-finals reached exactly three per match.
Then came the final weekend.
England and France produced ten goals in the third-place play-off. Spain and Argentina produced one in the final. Across those two games, the average was 5.5; the experience of watching them could not have felt more different.
The contrast is a useful reminder that tournament-wide averages describe the competition, not any single match. World Cup 2026 was high-scoring, but it still ended with a final defined by patience, control and a refusal to concede.
The Tournament Saved Plenty for the End
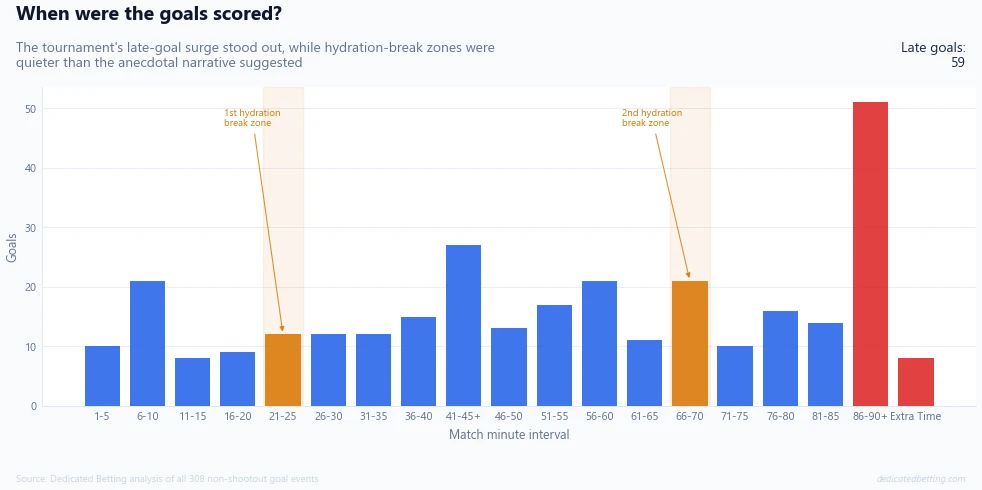
The most productive scoring interval was not near the start of either half. It was the end.
Fifty-one goals arrived from the 86th minute onwards, including second-half stoppage time. Add the eight goals scored in extra time and the late total reaches 59.
That is 19.2% of every goal in the tournament.
Some of that is structural. Teams behind late in matches have to take greater risks. Knockout games create desperate final attacks. Stoppage time was also substantial throughout the competition, giving the 86–90+ category more actual playing time than a standard five-minute interval.
Even with those caveats, the pattern shaped how the tournament felt. Leads rarely looked completely secure. Matches that appeared to be drifting towards a conclusion kept finding one final incident.
Argentina's semi-final win over England was the clearest example. England led until the 85th minute and were behind by the 92nd. What looked like a place in the final disappeared in seven minutes.
Hydration Breaks: Momentum Shift or Television Narrative?
The mandatory hydration breaks became one of the tournament's biggest arguments.
Referees stopped every match around the midpoint of each half. Players went to the touchline, managers delivered instructions and broadcasters found space for another interruption. Supporters and pundits began calling them "momentum breaks", particularly when a struggling team improved after the restart.
The examples were easy to remember. Brazil equalised shortly after a break against Morocco. Germany regrouped before pulling away from Curaçao. Canada, Scotland and Australia all scored soon after interruptions during the opening phase of the tournament.
But memorable examples are not the same as a tournament-wide effect.
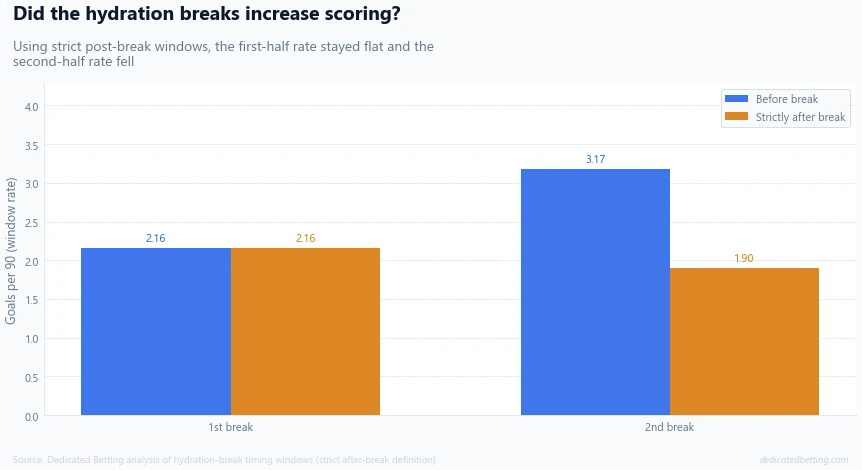
We analysed all 208 scheduled hydration breaks using strict windows before and after each pause.
| Break | Before | Strictly after |
|---|---|---|
| First-half break | 2.16 goals per 90 | 2.16 |
| Second-half break | 3.17 goals per 90 | 1.90 |
The first-half result could not be flatter: the scoring rate was identical before and after the break.
The second-half result goes against the popular story. Scoring fell from 3.17 goals per 90 in the pre-break window to 1.90 afterwards.
That does not mean the hydration break caused scoring to fall. The windows occur at different points in the match, teams behave differently depending on the score and the data does not contain timestamped shots, possession or xG. We can measure goals around the breaks, but not every underlying change in pressure.
What we can say is more limited, and more useful:
The tournament-wide scoring data does not support the claim that hydration breaks consistently created an attacking surge.
Did Losing Teams Benefit?
The strongest argument for the breaks was tactical. A manager whose team was struggling received three minutes to calm players, change the press or explain where an opponent was creating overloads.
If that advantage mattered consistently, trailing teams should have been more likely to score next.
They were not.
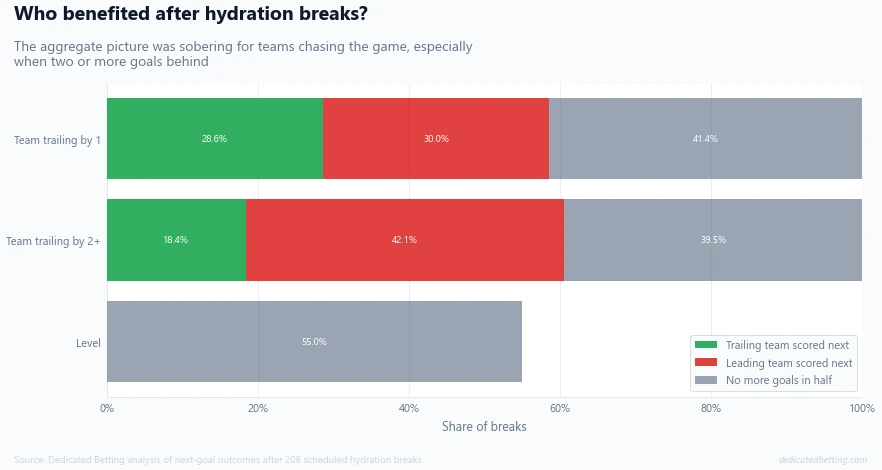
When a team trailed by one goal at the break:
- The trailing team scored next in 28.6% of cases.
- The leading team scored next in 30.0%.
- There was no further goal in the half in 41.4%.
When a team trailed by two or more:
- The trailing team scored next in 18.4% of cases.
- The leading team scored next in 42.1%.
- There was no further goal in 39.5%.
The break may have helped individual managers in individual matches. Carlo Ancelotti said as much after Brazil changed shape against Morocco.
Across the full tournament, however, teams in serious trouble were more likely to concede again than mount a recovery. The hydration break was not a general equaliser. Stronger teams remained stronger after everyone had taken a drink.
The Champions Were Not the Best Finishers
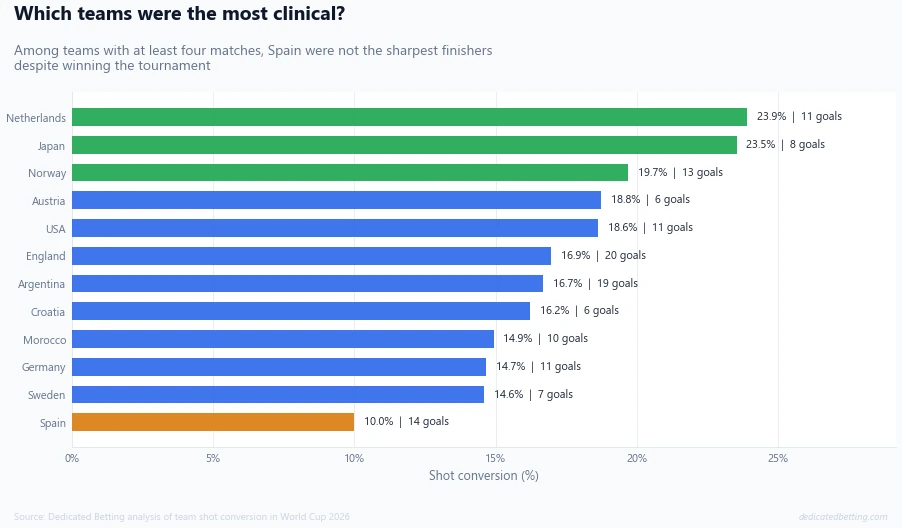
High conversion helped drive the tournament's 43-goal xG surplus, but the champions were not one of its most clinical teams.
Spain scored 14 times from 140 shots, a conversion rate of 10.0%. They created enough to score more, not less, and finished the tournament below their expected-goal total.
Argentina were the opposite. They scored 19 goals from fewer shots than Spain and repeatedly punished opponents during moments when games became unstable.
England also finished significantly above expectation, ending with 20 goals and the tournament's most explosive final appearance: six against France.
The obvious conclusion would be that clinical finishing wins tournaments. World Cup 2026 supplied an awkward exception.
Spain won it while leaving chances unfinished.
Goals Versus xG: Who Ran Hot?
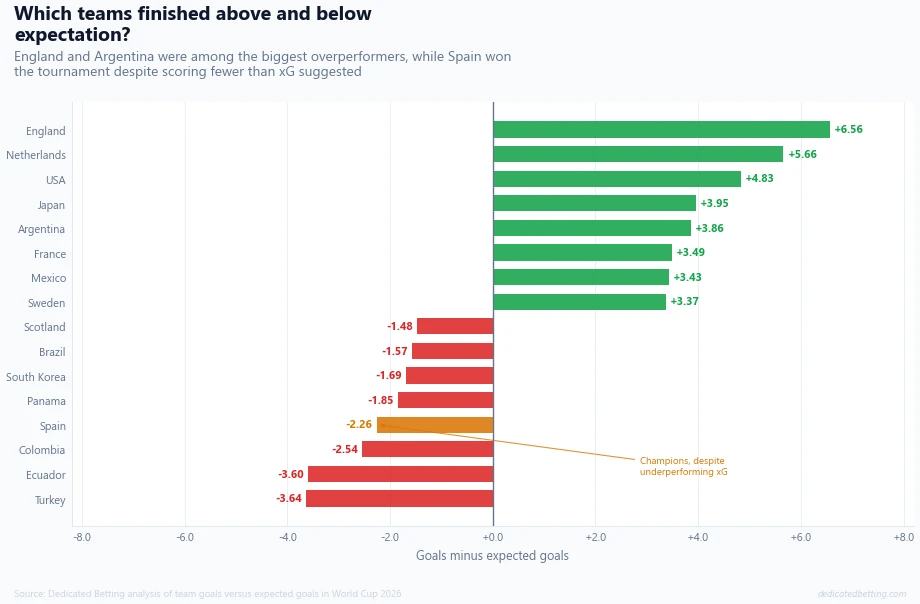
Expected goals are not a verdict on whether a result was deserved. They estimate the quality of the chances a team created or conceded.
Over 38 league matches, finishing tends to move closer to expectation. A World Cup is far shorter. One exceptional week can define the entire tournament.
England finished 6.56 goals above xG. The Netherlands were 5.66 above, the United States 4.83 above and Argentina 3.86 above.
Spain finished 2.26 below.
That combination is unusual for a champion. Spain did not survive because they repeatedly scored from low-quality chances. They survived because opponents barely scored at all.
The tournament's best finishers made the scoreboard move. Its best defensive side took the trophy.
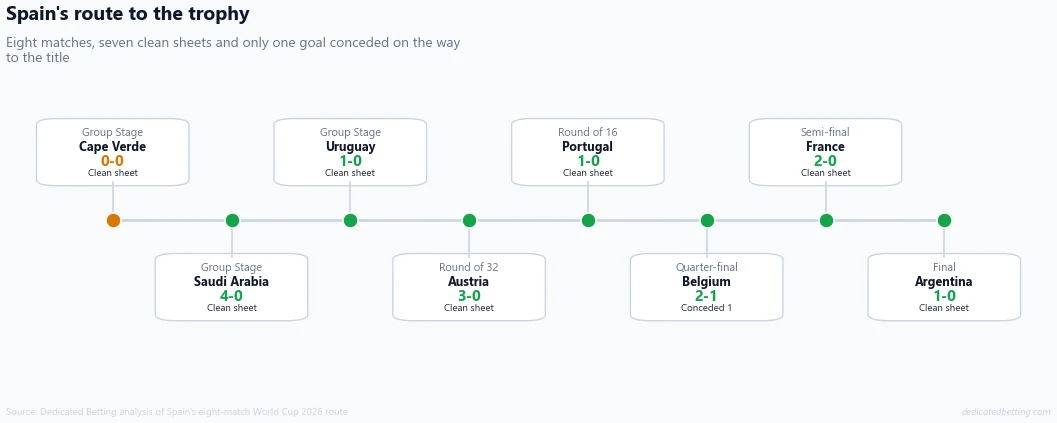
Spain's Eight-Match Wall
| Stage | Result |
|---|---|
| Group stage | Spain 0–0 Cape Verde |
| Group stage | Spain 4–0 Saudi Arabia |
| Group stage | Uruguay 0–1 Spain |
| Round of 32 | Spain 3–0 Austria |
| Round of 16 | Portugal 0–1 Spain |
| Quarter-final | Spain 2–1 Belgium |
| Semi-final | France 0–2 Spain |
| Final | Spain 1–0 Argentina after extra time |
Belgium's quarter-final goal was the only one Spain conceded.
France entered the semi-final with 16 tournament goals and were held to 0.30 xG. Argentina entered the final with 19 goals and did not record a shot on target.
Spain's own finishing was imperfect, but their matches did not require perfect finishing. One goal was enough against Uruguay, Portugal and Argentina. Two were more than enough against France.
The echoes of 2010 were unavoidable. That Spain side won every knockout match 1–0. The 2026 team were more expansive, but the same principle returned when the tournament became most difficult: control the ball, control the territory and remove the opponent's route to goal.
Spain became world champions for the second time. They also became the first nation to hold the men's and women's World Cups simultaneously.
For a full account of the final, including the 20–2 shot count and Ferran Torres' extra-time winner, read our Spain 1–0 Argentina match report.
Mbappé Reached Double Figures
| Player | Team | Goals |
|---|---|---|
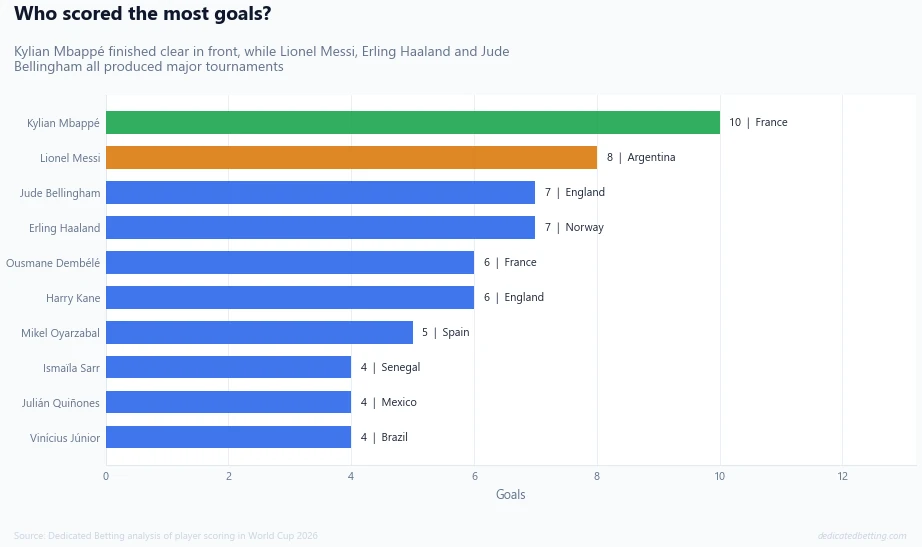
| Kylian Mbappé | France | 10 |
| Lionel Messi | Argentina | 8 |
| Erling Haaland | Norway | 7 |
| Jude Bellingham | England | 7 |
| Ousmane Dembélé | France | 6 |
| Harry Kane | England | 6 |
| Mikel Oyarzabal | Spain | 5 |
Kylian Mbappé did not leave with the trophy, but he produced the tournament's outstanding scoring campaign.
Ten goals is a different category of Golden Boot. During the 32-team era from 1998 to 2022, the award was won with between five and eight. Expansion gave elite forwards an extra possible match, but opportunity alone does not explain reaching double figures.
Mbappé scored twice in the 6–4 defeat by England and finished two clear of Lionel Messi. His career World Cup total moved into historic territory before his 28th birthday.
Messi's eight goals carried Argentina back to the final at 39. Haaland reached seven despite Norway exiting earlier than the leading nations, while Bellingham's seven formed part of an England attack that eventually finished with 20.
The Golden Boot did not belong to a finalist. The leading scorer came from the team that finished fourth.
Again, the tournament refused to make its biggest numbers line up neatly with its final standings.
The Matches That Defined It
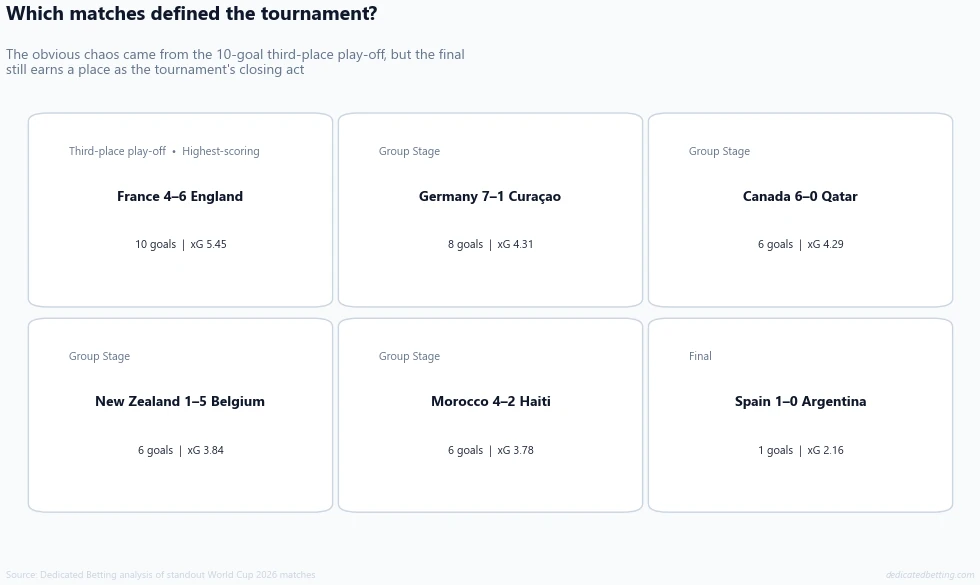
France 4–6 England
A third-place play-off that behaved like nobody had told the teams what third-place play-offs normally look like.
England led 4–0 at half-time, France scored four times after the interval, Bukayo Saka completed a hat-trick and the match finished with ten goals. It joined the small group of double-figure scoring games in World Cup history.
Germany 7–1 Curaçao
Curaçao briefly had the tournament fairytale. They equalised shortly before the first-half hydration break. Germany used the pause to reset and scored six more.
It became one of the results most frequently cited by critics who called hydration breaks tactical timeouts. Across 208 breaks, the wider pattern was far less dramatic.
Canada 6–0 Qatar
One of the co-hosts produced the tournament's biggest clean-sheet win and secured a place among the competition's largest winning margins.
Canada and Mexico both reached the Round of 16. The United States did the same, meaning all three hosts progressed beyond the group stage before exiting at the first knockout hurdle.
Spain 1–0 Argentina
The final belongs here precisely because it did not resemble the others.
Spain had 20 shots to Argentina's two and 12 on target to none, yet needed extra time to score. Ferran Torres finally broke the deadlock in the 106th minute.
The tournament ended not with another avalanche, but with the strongest team eventually turning dominance into one decisive goal.
Not Every Match Was a Goal Rush
| Match total | Number of matches |
|---|---|
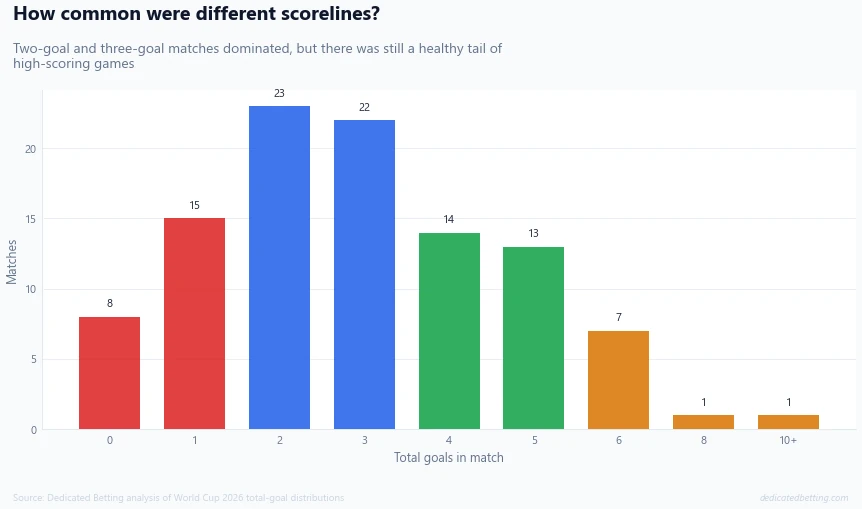
| 0 goals | 8 |
| 1 goal | 15 |
| 2 goals | 23 |
| 3 goals | 22 |
| 4 or more | 36 |
| 5 or more | 22 |
| 6 or more | 9 |
| 8 or more | 2 |
| 10 or more | 1 |
Two and three-goal matches were the most common, accounting for 45 of the 104 fixtures.
At the other end, eight matches finished goalless. Expansion introduced more mismatches and several heavy wins, but it did not turn every fixture into a procession. Almost half of the tournament still ended with two goals or fewer.
The high average came from the tail. Thirty-six matches reached four goals, 22 reached five and nine produced at least six.
A relatively small group of extraordinary games pulled the tournament upwards — exactly the kind of pattern an average can hide.
Cards, Fouls and the Difference Between 15 and 16
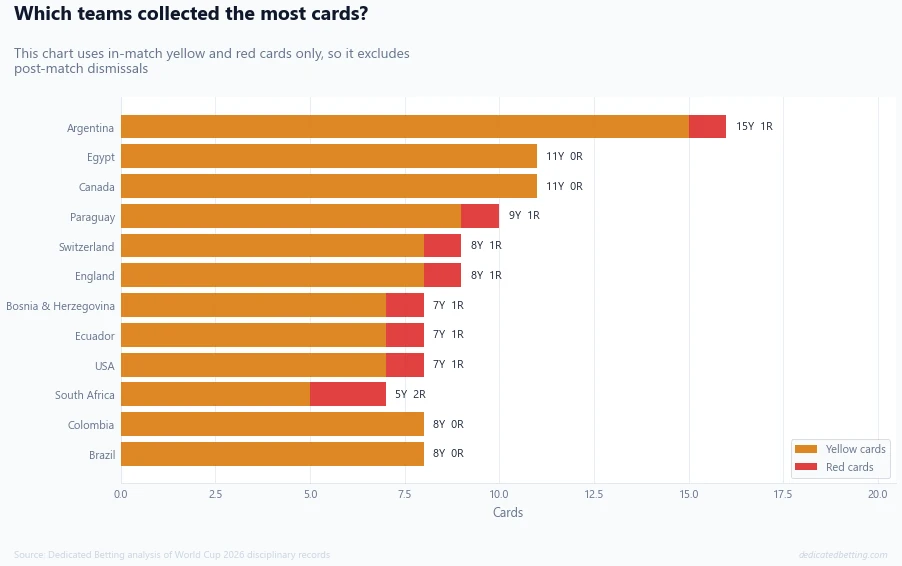
The match data records 267 yellow cards and 15 red cards during play.
A broader tournament dismissal count reaches 16 because Leandro Paredes was sent off after the final whistle. Both numbers can be correct; they answer slightly different questions.
For consistency, our team chart uses in-match cards only.
The tournament also contained 2,393 fouls, almost exactly 23 per match. That is enough disruption to matter without turning the competition into an endless sequence of stoppages.
The more unusual interruptions came from elsewhere: hydration breaks, lengthy added time and the expanded schedule itself.
What Did the 48-Team Format Actually Change?
The easiest answer is scale.
| Measure | World Cup 2022 | World Cup 2026 |
|---|---|---|
| Teams | 32 | 48 |
| Matches | 64 | 104 |
| Knockout teams | 16 | 32 |
| Total goals | 172 | 308 |
| Goals per match | 2.69 | 2.96 |
There were 62.5% more teams and 62.5% more matches. Total goals increased by 79.1%.
That difference matters. The tournament did not merely become longer; it became more productive per fixture.
The new Round of 32 also changed the shape of the competition. Thirty-two of 48 teams advanced from the group stage, reducing the penalty for finishing third. More nations remained alive deeper into the schedule, but the first knockout round also created another set of mismatches between leading contenders and weaker qualifiers.
The format produced more opportunity, more jeopardy and considerably more content. Whether every one of the 104 matches felt essential is a different question.
Statistically, though, expansion did not dilute the tournament into lower-scoring football. The opposite happened.
The Number That Best Explains the Champion
There are several candidates for the defining number of World Cup 2026.
308 captures the scale.
43.1 captures the finishing.
59 captures the late drama.
10 captures Mbappé's Golden Boot and England's extraordinary win over France.
But the number that explains who won is one.
Spain conceded one goal in eight matches. They shut out France and Argentina, the two other highest-ranked teams entering the decisive weekend. They held Argentina without a shot on target in the final.
A tournament full of goals was won by the team that almost never allowed one.
That is not a contradiction. It is the point.
Methodology: match, team and player totals are calculated from all 104 completed World Cup 2026 fixtures. Penalty-shootout kicks are excluded from goal totals and player scoring. Goals recorded at 45+ and 90+ remain within first- and second-half stoppage-time intervals; only events after minute 90 are classified as extra time. Hydration-break analysis uses nominal break points at minutes 22 and 67 and compares strict regulation-time windows before and after each pause. The analysis is descriptive and does not establish that hydration breaks caused any change in scoring.
Related articles
Spain 1–0 Argentina: World Cup Final Match Report
Spain dominated the final but needed Ferran Torres' 106th-minute goal to turn control into the trophy: Spain 1–0 Argentina World Cup 2026 Final Match Report.
Spain vs Argentina Final Preview
How the model assessed the finalists before kick-off, including Spain's control, Argentina's finishing and the low-confidence prediction that narrowly went the wrong way: Spain vs Argentina World Cup 2026 Final Preview.
World Cup 2026 Golden Boot Odds
Our pre-tournament analysis compared team progression, club form, penalty duties and international scoring records. See which calls held up after Mbappé reached ten goals: World Cup 2026 Golden Boot Odds.
World Cup 2026 Predictions
The original model rated Spain as the number-one team before the tournament, with Argentina third and France second: World Cup 2026 Predictions.